This page shows the different Dashboads I created with my analysis of the results
Ottawa Traffic Dashboard
Complete dashboard is avaiable here: Ottawa Traffic Dashboard
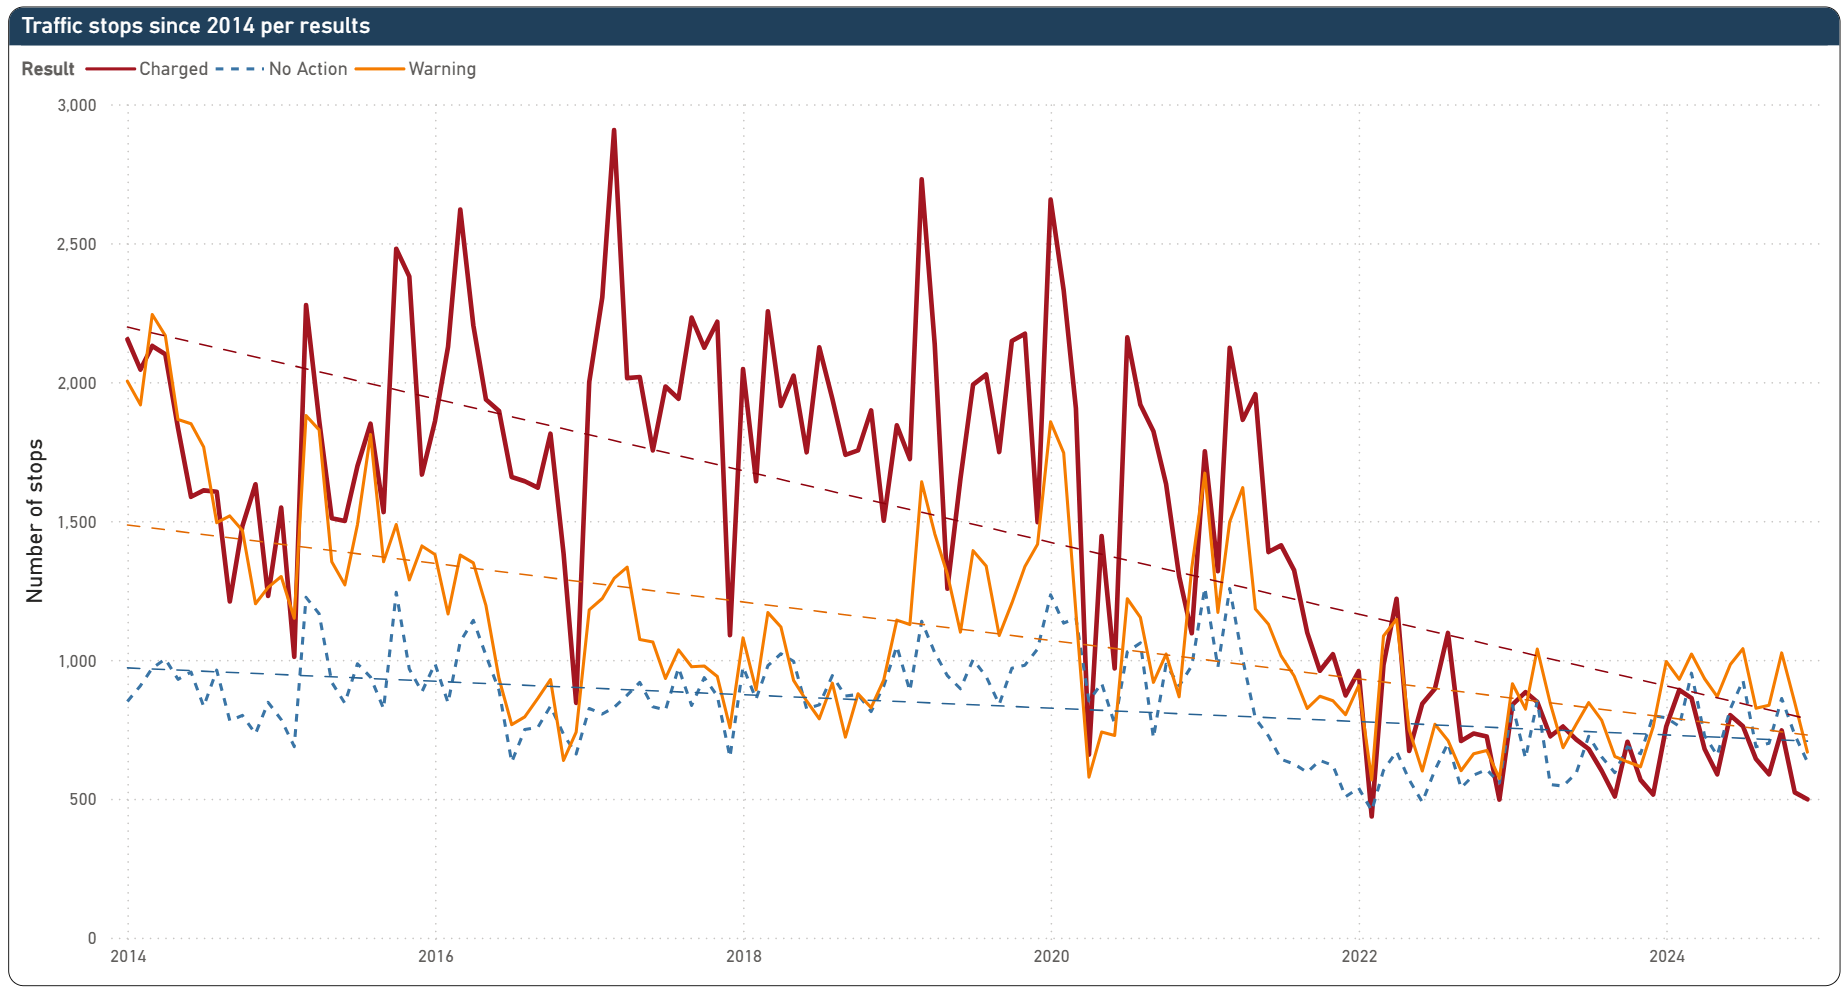 This graph shows the number of Traffic stops from the Ottawa Police Service by result types: Charged (red line), Warning (orange line) and No action (blue dotted).
We can notice a decrease of stops in the recent years and patricularly of people charged.
This seems at odds with my anecdotal observations of the recent driving conditions in Ottawa (people runing red lights, not stopping for pedestrians...)
This graph shows the number of Traffic stops from the Ottawa Police Service by result types: Charged (red line), Warning (orange line) and No action (blue dotted).
We can notice a decrease of stops in the recent years and patricularly of people charged.
This seems at odds with my anecdotal observations of the recent driving conditions in Ottawa (people runing red lights, not stopping for pedestrians...)